COP21 – Zelfs 2° is te veel: zeespiegelstijging zichtbaar gemaakt
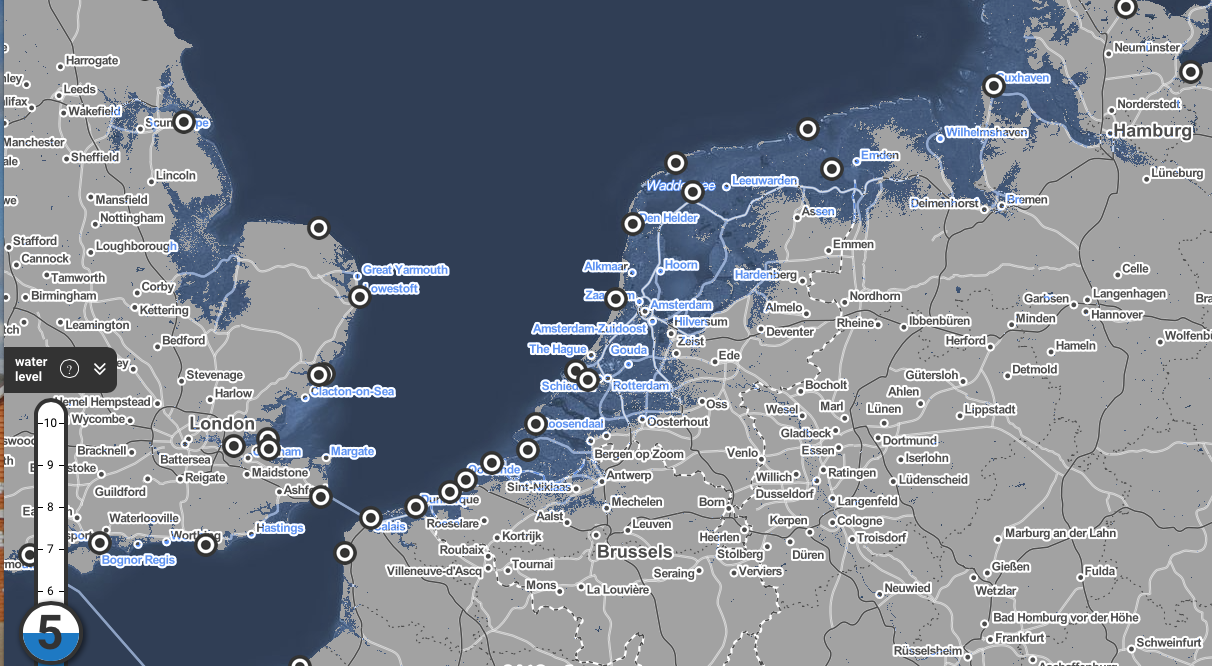
11 november 2015 – Climate Central heeft, gericht op COP21, in kaarten en foto’s zeer zichtbaar gemaakt wat de gevolgen van zeespiegelstijging zullen zijn. Ook voor Nederland. Bij een opwarming van de aarde met twee graden zal in de verre toekomst bijna de helft van ons land onder water komen te staan (zie kaart hierboven).
Voor alle duidelijkheid: op dit moment leiden alle klimaatplannen samen nog steeds tot een temperatuurstijging van 2,7° en zal de inspanning van COP21 erop gericht zijn de temperatuur niet verder op te laten lopen dan 2°.
De gevolgen die Climate Central laat zien zijn gevolgen op de langere termijn: ‘binnen enkele honderden jaren’.
Climate Central is een Amerikaans klimaatonderzoekbureau waar vooraanstaande wetenschappers werken, maar ook journalisten om de gevolgen van de kliomaatverandering inzichtelijk te maken.
Climate Central heeft nu voor de hele wereld kaarten gepubliceerd die laten zien wat de gevolgen zijn van de zeespiegelstijging in drie scenario’s: bij een temperatuurstijging van 1,5°, van 2° en van 4°.
Zelfs als de temperatuurstijging tot gemiddeld 2° beperkt kan worden blijken enorme gebieden en vele grote steden onder water komen te staan. (In Nederland wordt het opeens ‘Hilversum aan Zee’.)
De zeespiegelstijging ontstaat ruwweg door een combinatie van het smelten van ijskappen en het uitzetten van het opgewarmde zeewater.
Uit het bericht van Climate Central
‘(…) Carbon emissions causing 4°C of warming — what business-as-usual points toward today —- could lock in enough sea level rise to submerge land currently home to 470 to 760 million people, with unstoppable rise unfolding over centuries. At the same time, aggressive carbon cuts limiting warming to 2°C could bring the number as low as 130 million people. These are the stakes for global climate talks December in Paris.
Our analysis details the implications of different warming scenarios for every coastal nation and megacity on the planet, and our globally searchable Mapping Choices tool maps them. We are also publishing Google Earth fly-over videos and KML contrasting these different futures for important cities around the world, and printable high-resolution photorealistic images of select global landmarks. We have made these visualizations embeddable and downloadable. These are the stakes for global climate talks, in pictures.
Some of our major findings include:
- China, the world’s leading carbon emitter, leads the world, too, in coastal risk, with 145 million people living on land ultimately threatened by rising seas if emission levels are not reduced.
- China has the most to gain from limiting warming to 2°C, which would cut the total to 64 million.
- Twelve other nations each have more than 10 million people living on land at risk, led by India, Bangladesh, Viet Nam, Indonesia, and Japan.
- The U.S. is the most threatened nation outside of Asia, with roughly 25 million people on implicated land.
- Meeting the 2°C goal would cut exposure by more than half in the U.S., China, and India, the world’s top three carbon emitters, as well as in many other nations.
- Global megacities with the top-10 largest threatened populations include Shanghai, Hong Kong, Calcutta, Mumbai, Dhaka, Jakarta, and Hanoi. (…)’
Uit de toelichting bij de kaarten
‘(…) These are the four warming levels for which these maps visualize projections of committed sea level rise.
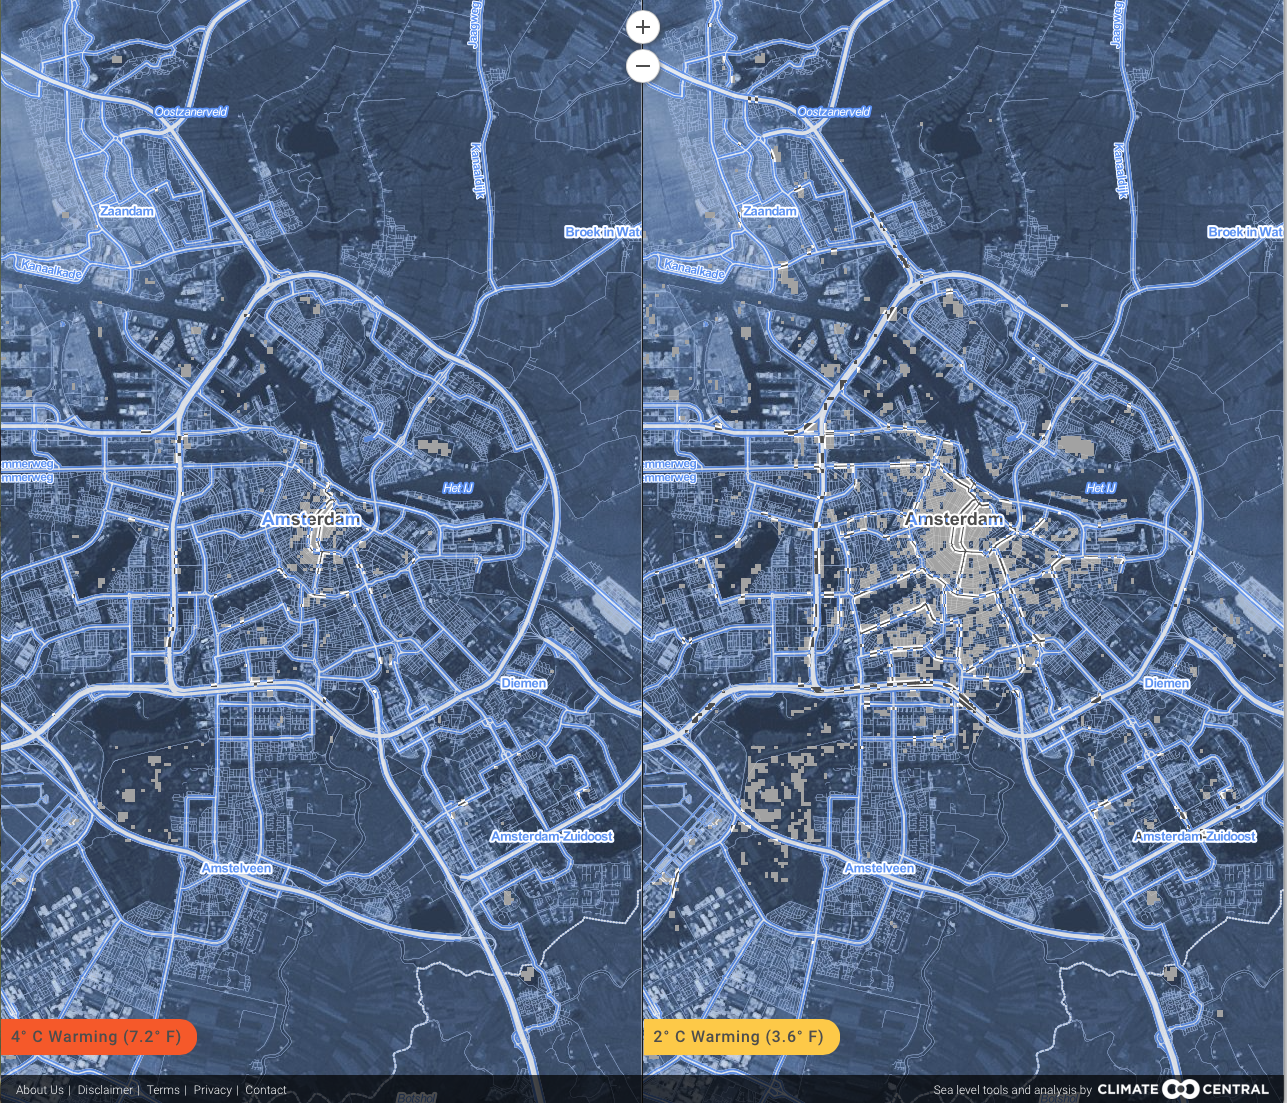
Warming of 2 °C (3.6 °F) is a long-standing international target, and corresponds to what many would consider successful global efforts to control greenhouse gas emissions. It also corresponds, in this analysis, to 4.7 meters (15.4 feet) of global sea level rise locked in to someday take place.
Warming of 4 °C (7.2 °F) is close to our current path, would represent a breakdown in efforts, and corresponds to 8.9 m (29.2 ft) of locked-in global sea level rise. The span from 2-4 °C covers the likely range of possible outcomes from global climate talks at COP21 in Paris.
Warming of 3 °C (5.4 °F) corresponds roughly to the current sum of “intended nationally determined commitments” for reducing emissions, and 6.4 m (21.0 ft) of locked-in global sea level rise.
Warming of 1.5 °C (2.7 °F) is the preferred goal of many island nations as compared to 2 °C (3.6 °F), and corresponds to 2.9 m (9.5 ft) of locked-in rise. (…)’
Zelfs bij een temperatuurstijging van 2° komt Amsterdam
over honderden jaren bijna geheel onder water te staan.
Highlights in 21 min.
Bijvoorbeeld Londen (bij 2° en bij 4° temperatuurstijging)
Bijvoorbeeld Hamburg (bij 2° en bij 4° temperatuurstijging)
.
Bronnen
Climate Central, 8 november 2015: New Report and Maps: Rising Seas Threaten Land Home to Half a Billion
Climate Central, Mapping Choices: Which sea level will we lock in?
Kaarten: Risk zone map (vul land of stad in) (Gebruiksaanwijzing: met + en – rechts in- en uitzoom. Links kiezen voor meters in plaats van feet. Voor 2° temperatuurstijging schuif op 4,7 meter zetten, voor 1,5° op 2,9 meter)
Kaarten: Ga naar kaart en vul plaats in (effecten voor steden)
Video’s: Cities at risk from Sea Level Rise: Google Earth Video
Zie ook
FluxEnergie, 11 november 2015: COP21 – De foto’s die je nooit wilt maken